|
|
|


National Iodine Deficiency Disorders Control Programme Status Report
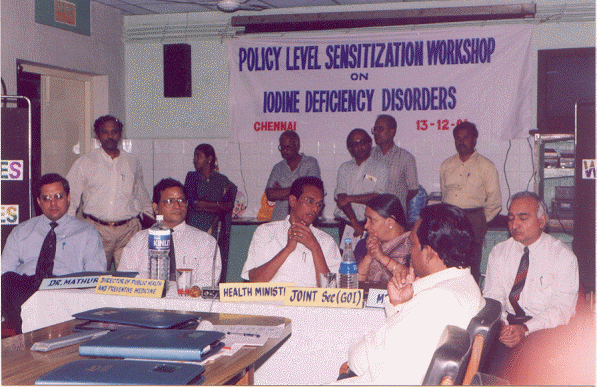
STRENGTHENING OF IODINE DEFICIENCY DISORDER CELL LABORATORY The? Government? of? India?? have?? supplied?? Laboratory equipments? worth? of? Rs.3? lakhs? for conducting Urinary Iodine analysis. The? Central? Nutrition? Bureau? Laboratory? of? this??????? Directorate is? carrying? out? this? activity.??? Two? Laboratory Assistants? are? already? trained? at?? National?? Institute?? of? Communicable Diseases,? New? Delhi.? During? the year 2000, 123 samples of urine were analysed out of which 19 were found? to? be normal? (25? and? above? microgram? of Iodine) and 104 were belownormal (below 25 microgram of Iodine). During the year 2001, 100 samples of urine were analysed and all 100 were found to be below normal. ACTIVITIES UNDER NIDDCP (1998 - 1999) 1.? Celebration of Global IDD day at Chennai. ACTIVITIES UNDER NIDDCP (1999 - 2000) 1.? State level advisory committee meeting on IDD program at the Directorate. a?? One line stickers for bumpers of vehicles- 10000 numbers. ACTIVITIES UNDER NIDDCP (2000 - 2001) ACTIVITIES UNDER NIDDCP (2001 - 2002)
DECISION TAKEN BY GOVERNMENT OF INDIA The State Health Ministers meeting was held on? 31.8.2000 to? discuss? the? issue? of? compulsory? iodisation? of salt as a strategy to combat Iodine Deficiency Disorders.? The? matter? has been examined? comprehensively by the Government.? In view of the decision to withdraw the earlier central notification introducing compulsory iodisation of salt for direct human consumption it has requested that State Governments may consider the need for having statutory provision for compulsory iodisation of salt? under? the PFA? Act? 1954,? covering part or? whole of the State, In view of above, in the State of Tamilnadu? the? ban? on? common? salt? for edible purpose will continue for another 5 years with effect from? 1.1.2000. ?? ANNEXURE I??????? RESULTS OF GOITRE SURVEYS ------------------------------------------------------------------ ?S.No.????? District?????? Year?????? Cases?????? Goitre????? % ?------------------------------------------------------------------ ? 1.? Ramanathapuram?????? 1995?????? 13718?????? 2464????? 18.0 ? 2.? The Nilgiris???????? 1999?????? 19659?????? 3273????? 16.6 ? 3.? Thiruvarur?????????? 1998?????? 12496?????? 1817????? 14.5 ? 4.? Salem??????????????? 1999?????? 46514?????? 5802????? 12.5 ? 5.? Virudhunagar???????? 1995?????? 11000?????? 1437????? 13.1 ? 6.? Villupuram?????????? 1999?????? 44700?????? 5376????? 12.0 ? 7.? Coimbatore?????????? 1995?????? 36999?????? 4316????? 11.7 ? 8.? Kanniyakumari??????? 1999?????? 25243?????? 2966????? 11.7 ? 9.? Dharmapuri?????????? 1999?????? 65792?????? 7576????? 11.5 ?10.? Pudukottai?????????? 1998?????? 24603?????? 2741????? 11.1 ?11.? Namakkal???????????? 1998?????? 12789?????? 1338????? 10.5 ?12.? Nagapattinam???????? 1998?????? 14185?????? 1471????? 10.4 ?13.? Erode??????????????? 1998?????? 22342?????? 2321????? 10.4 ?14.? Perambalur?????????? 1999?????? 25240?????? 2636????? 10.4 ?15.? Tuticorin??????????? 1995?????? 18119?????? 1865????? 10.3 ?16.? Thanjavur??????????? 1998?????? 16337?????? 1659????? 10.2 ?17.? Chennai????????????? 1996?????? 25483?????? 2567????? 10.1 ?18.? Trichirapalli??????? 1999?????? 33523?????? 3362????? 10.0 ?19.? Theni??????????????? 1998?????? 14549?????? 1350?????? 9.3 ?20.? Thiruvannamalai????? 1999?????? 48848?????? 4563?????? 9.3 ?21.? Dindigul???????????? 1999?????? 53719?????? 4742?????? 8.8 ?22.? Vellore????????????? 1997?????? 36331?????? 3085?????? 8.5 ?23.? Kancheepuram???????? 1997?????? 21301?????? 1680?????? 7.9 ?24.? Cuddalore??????????? 2000?????? 45592?????? 3547?????? 7.8 ?25.? Sivaganga??????????? 1995?????? 23868?????? 1815?????? 7.6 ?26.? Thiruvallur????????? 1996?????? 19823?????? 1480?????? 7.5 ?27.? Tirunelveli????????? 1995?????? 27674?????? 1928?????? 7.0 ?28?? Madurai????????????? 2000?????? 42506?????? 2687?????? 6.3 ?29.? Karur??????????????? 2000?????? 29614?????? 1057?????? 3.6 -------------------------------------------------------------------- ??ANNEXURE? II A SURVEY ON THE AWARENESS, AVAILABILITY AND ACCEPTABILITY OF IODISED SALT -? RESULTS AT A GLANCE??? ---------------------------------------------------------------------------------- ???????? DETAILS?????????????????????????? GROUP A??? GROUP B???? STATE ??? ------------------------------------------------------------------------------ ??? No. of villages surveyed????????????????? 270??????? 990?????? 1260 ??? No. of households surveyed?????????????? 5100????? 19460????? 24560 ??? Retail shops surveyed??????????????????? 1310?????? 4488?????? 5798 ??? Ration shops surveyed in Gr.A Dist??????? 180????????? -??????? 180 ??? Noonmeal centres surveyed???????????????? 457?????? 1640?????? 2097 ??? School hostels surveyed??????????????????? 59??????? 228??????? 287 ??? AWARENESS OF HOUSEHOLDS (%) ???????? On Iodised salt?????????????????????? 42???????? 35???????? 37 ???????? On Goitre???????????????????????????? 15???????? 14???????? 14 ??? SOURCES OF INFORMATION ON IODISED SALT (%) ???????? Health staff????????????????????????? 21???????? 20???????? 20 ???????? TV / Radio??????????????????????????? 49???????? 43???????? 44 ???????? Newspapers??????????????????????????? 10????????? 8????????? 9 ???????? Others??????????????????????????????? 20???????? 29???????? 27 ??? IDENTIFICATION OF IODISED SALT BY THE HOUSEHOLDS (%) ???????? Words 'Iodised Salt' on the packet??? 81???????? 82???????? 82 ???????? Logo of 'Smiling Sun'???????????????? 19???????? 18???????? 18 ??? AVAILABILITY OF IODISED SALT (%) ???????? Retailers selling Iodised salt ???????? as per spot test????????????????????? 76???????? 50???????? 56 ???????? Ration shops in Gr.A Dist (%) ???????? selling Iodised salt???????????????? 100?????????????????? 100 ??? ACCEPTABILITY OF IODISED SALT (%) ???????? Buying Iodised salt voluntarily?????? 58???????? 37???????? 43 ???????? Households using Iodised salt ???????? as per spot test????????????????????? 59???????? 28???????? 35 ???????? Noon meal centres using Iodised ???????? salt as per spot test???????????????? 52???????? 11???????? 20 ???????? School hostels using Iodised salt ???????? as per spot test????????????????????? 51???????? 25???????? 30 ??? REASONS GIVEN BY HOUSEHOLDS NOT USING IODISED SALT (%) ???????? Costly??????????????????????????????? 10???????? 19???????? 18 ???????? Not available in the village????????? 13???????? 21???????? 19 ???????? No idea on Iodised salt?????????????? 77???????? 60???????? 63??? ------------------------------------------------------------------- ??? GROUP A : Trichy, Karur, Perambalur, Thanjavur, Coimbatore,The Nilgiris, Salem, Namakkal Districts where Iodised? salt is sold through PDS. ??? GROUP B : Other Districts. ? The Salt samples analysed through spot testing is as follows ?
Click here to view Iodine Booklet
? |